QC & Data Quality Assessment
Assessment of sample quality, pooled-QC reproducibility, feature detection, coefficient of variation, filtering results, and overall analytical performance before downstream statistical analysis.
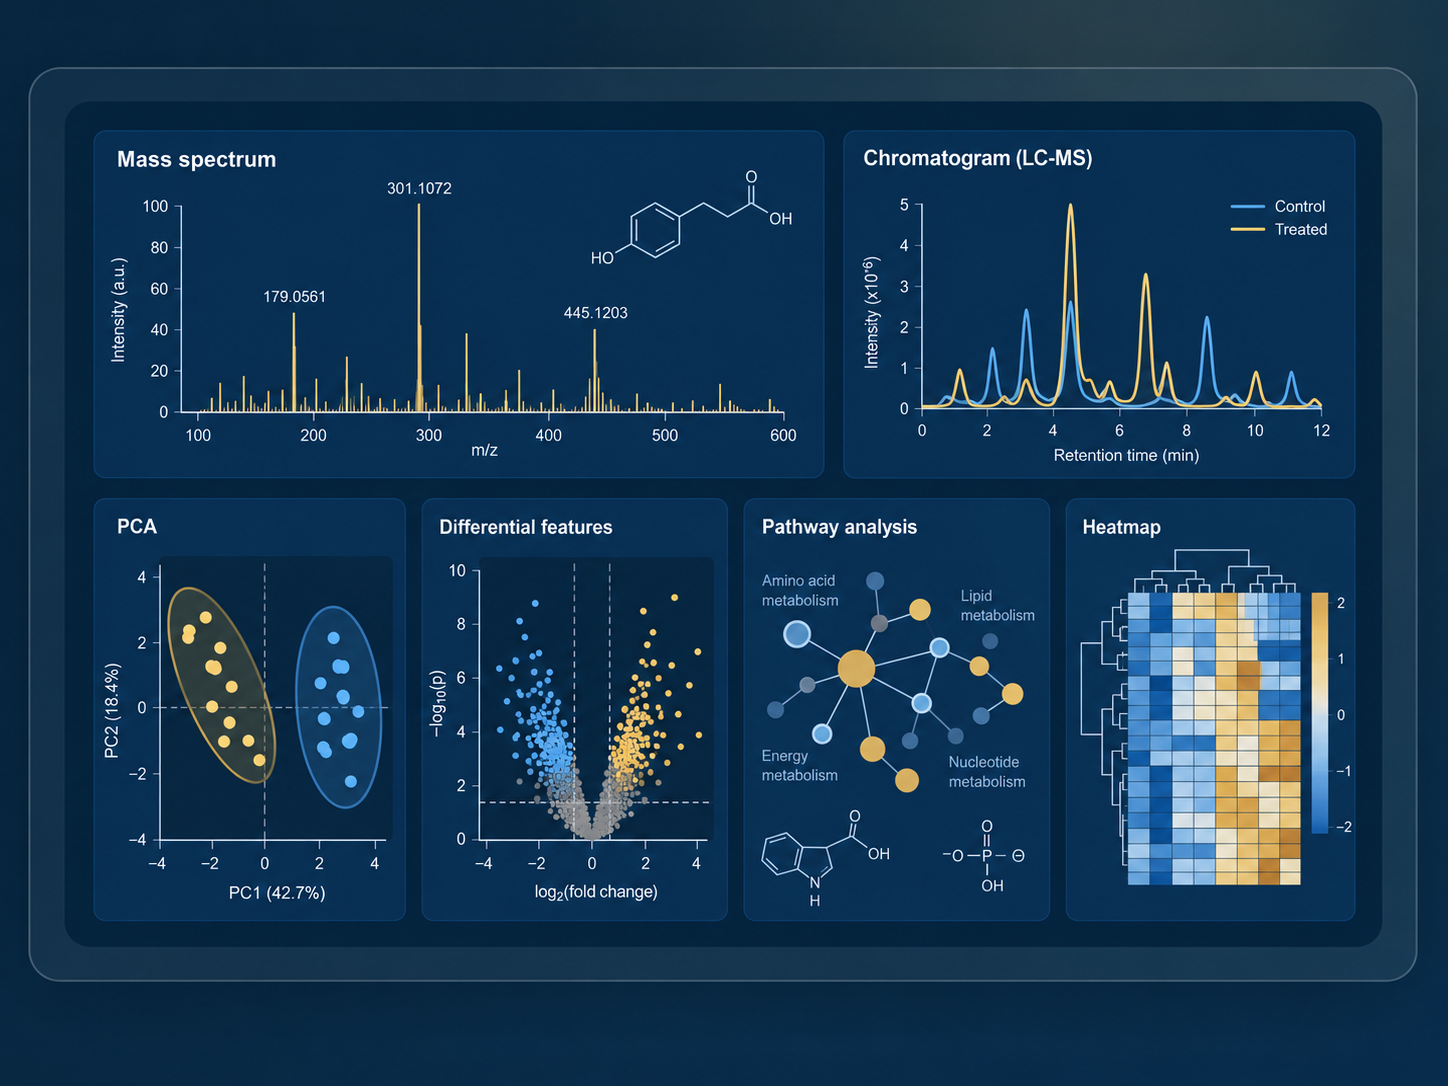
Integrated statistical analysis, compound annotation, visualization, and quality assessment help investigators move from complex datasets to clear, biologically meaningful results.
Analysis services
Our analysis workflows extend beyond generating lists of significant features. We assess data quality, apply appropriate statistical models, characterize patterns across samples and features, evaluate annotation confidence, and place findings in biological context.
Assessment of sample quality, pooled-QC reproducibility, feature detection, coefficient of variation, filtering results, and overall analytical performance before downstream statistical analysis.
PCA, clustering, heatmaps, and related exploratory analyses are used to identify sample relationships, outliers, and coordinated patterns associated with biological or experimental groups.
Fold change, t-tests, ANOVA, empirical-Bayes moderated statistics, post-hoc comparisons, multiple-testing correction, and selected machine-learning approaches are used as appropriate to the study design and analytical questions.
Integration of MS/MS and accurate-mass annotations, confidence-level reporting, and compound-class summaries for interpretable chemical context.
Pathway-oriented analysis, compound-class patterns, and interpretation of coordinated biological responses that transform complex feature-level data into meaningful biological insights.
Structured reports integrate results, figures, QC summaries, annotations, statistical interpretation, and literature context to connect analytical findings with biological pathways and processes, supporting follow-up studies and publication.
Example outputs
These illustrative examples represent the types of visual outputs commonly used in Core reports. Final figures are generated from the specific study design and data.
Visualize separation among experimental groups, identify outliers, and evaluate whether major sources of variance correspond to the study design.
Summarize coordinated abundance patterns, identify clusters with similar responses, and connect feature-level results to broader biological trends.
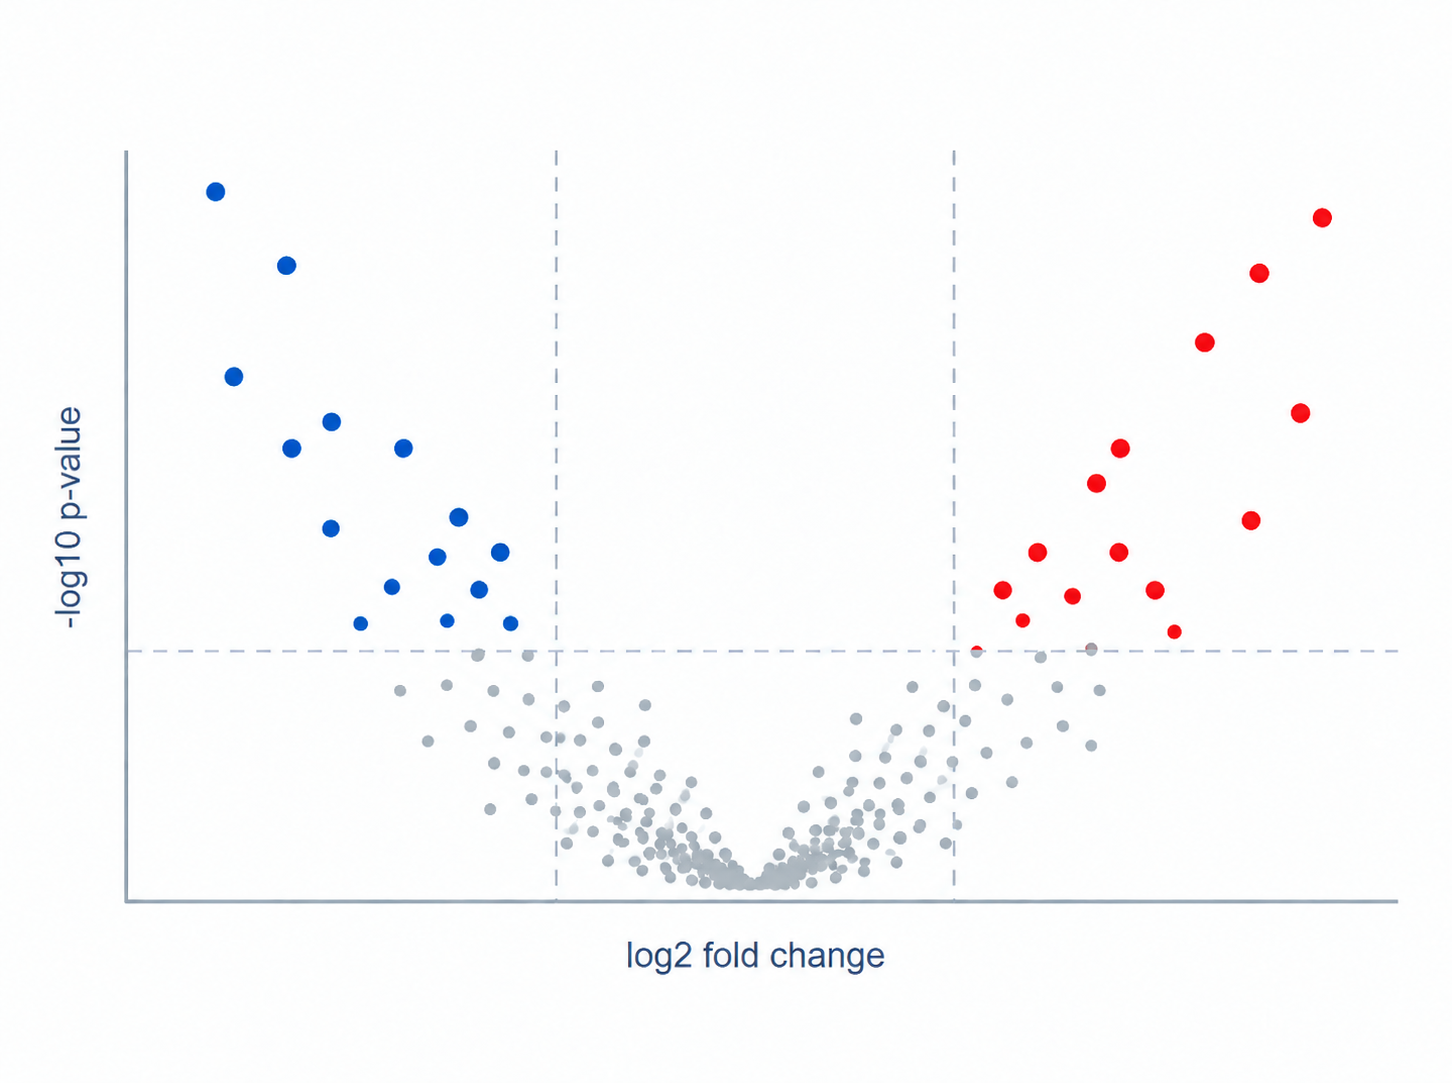
Combine effect size and statistical evidence to prioritize features, with appropriate distinction between exploratory uncorrected results and FDR-controlled findings.
Separate high-confidence spectral annotations from lower-confidence accurate-mass or formula matches and summarize results by compound class where possible.
Deliverables
In addition to comprehensive analytical reports, the Mass Spectrometry Core provides support for manuscript and grant preparation, including assistance with analytical methods, data processing descriptions, and interpretation of results. Investigators also receive access to their raw data for further analysis and future research.
Analysis can be incorporated into Core-generated metabolomics, lipidomics, proteomics, and targeted datasets, or discussed as a stand-alone bioinformatics need when appropriate.